Infographic - All In
For the module 'Design for Digital Media', I was tasked with creating an infographic that promoted social change. I chose the issue of LGBTQ+ equality and, after research surrounding this, chose the charity All Out to help illustrate this drive for change.
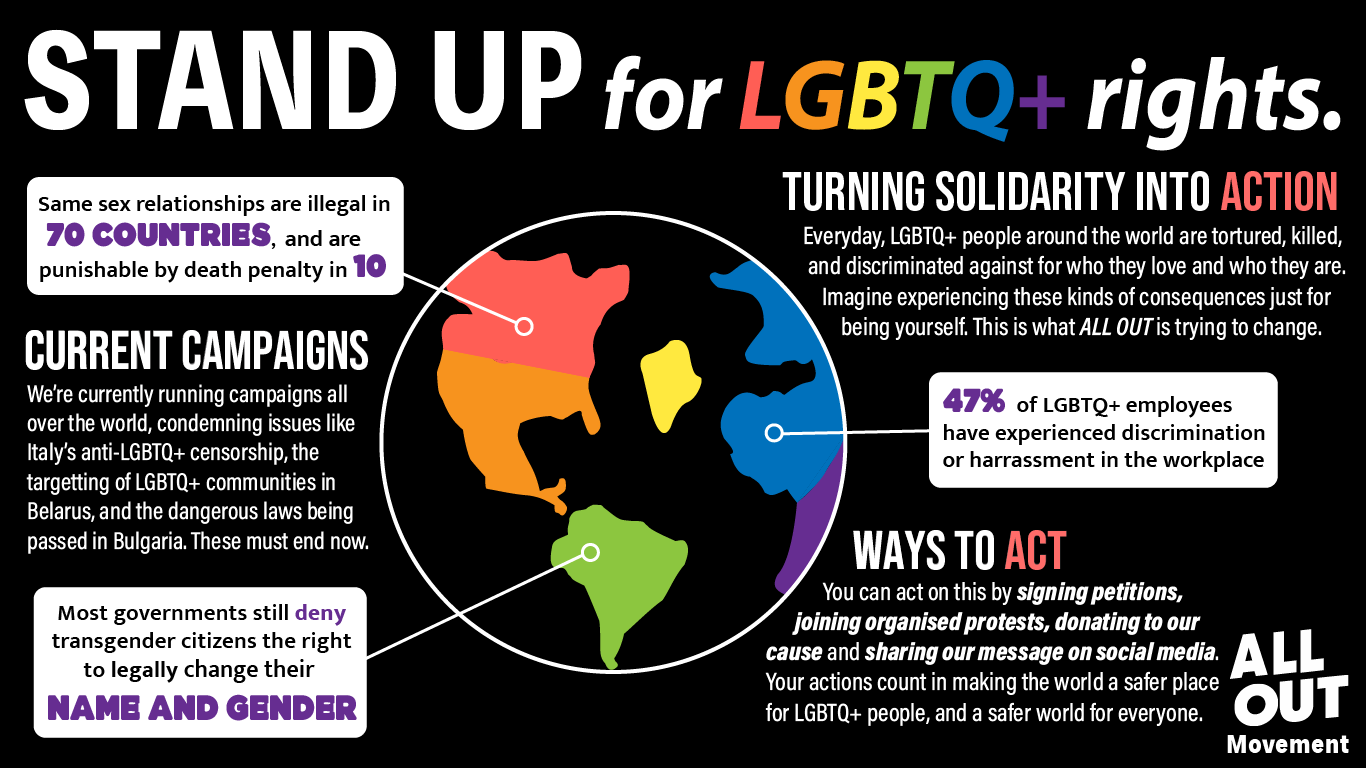
The infographic was created using Adobe Illustrator, and was made in response to my research around the topic of global LGBTQ+ legislation and statistics regarding their oppression by the law. I pulled the statistics from various sources, such as the All Out charity website and research from the Williams Institute, spanning both gay and transgender issues to represent the broad range of issues faced by the community.
I developed the visual components based upon this research, with the icon of the rainbow earth emphasising the globality of LGBTQ+ government oppression and showing that the community exists worldwide. I highlighted elements that I deemed more prominent, such as fragments of statistics and call-to-action words like 'act', to draw the attention of the consumer through the size, font, and colour of text.